An exploration
The Walking Economy
The economy that moves at walking pace
These explorations weave memory and present thinking — not records of what happened, but attempts to learn by holding the past and the present in the same frame. Why it reads this way →
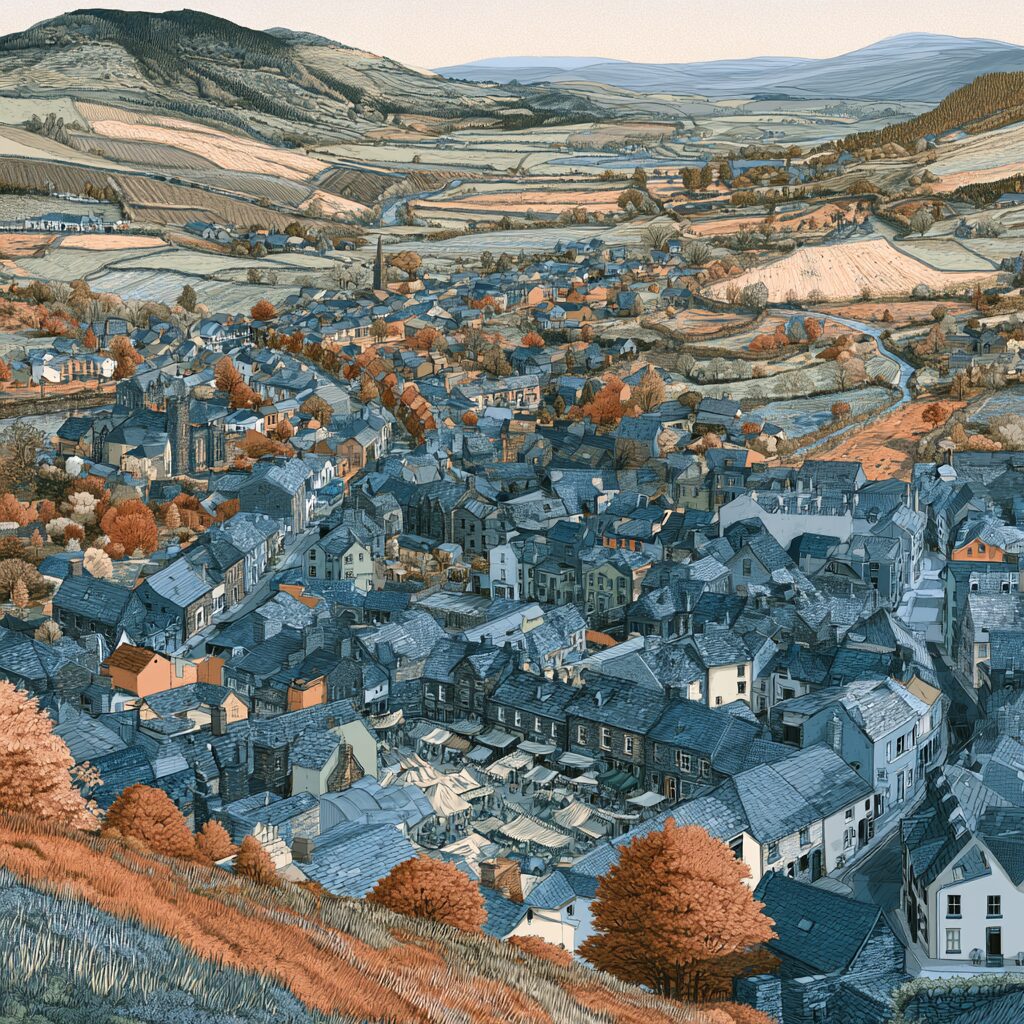
Two butchers in one town. None in the next. The towns are barely twenty minutes apart, similar in size, similar in surroundings. Yet one supports a trade the other has lost entirely. National statistics cannot see this. They record a region, a county, a local authority. The asymmetry that any resident could describe in a sentence is invisible to the data we plan with.
I have spent a long time interested in why. Around 2017 I started calling it the walking economy — an attempt to look at the part of economic life that moves slowly and stays rooted, and which our models, built for a faster world, quietly miss.
The +60km/h world
Most economic geography is built for speed. It measures the world of aircraft, motorways and intercity rail — the connectivity of places moving at sixty kilometres an hour and more. It is the geography of agglomeration, of journey times, of how quickly you can get from one centre to another. It is the world I explored in Ringing the Peaks: the national network, seen from above.
But there is an older geography underneath it, and it moves at walking pace. Before the car, a market town existed to serve the country around it — the farms and villages within a morning's walk or cart ride. That distance defined a catchment. The town was the centre of a hinterland, and people knew where their centre was. This is not nostalgia. It is structure, and much of it survives.
Before we measured a place by how fast you could leave it, we measured it by how far you could walk to it.
What the market town knew
This is one of the oldest ideas in geography. In 1933 Walter Christaller set it out as central place theory: settlements exist to supply goods and services to a surrounding market area, and they arrange themselves into a hierarchy — many villages, fewer towns, fewer cities still. Two simple forces govern it. The threshold: the minimum custom a service needs to survive. And the range: the furthest people will travel to reach it. Between them they draw a catchment. A generation earlier, Reilly had described the same thing as a kind of gravity — the pull of a town rising with its size and falling with distance.
Draw those catchments and something useful appears: the buffer. Around every town is a zone where its pull fades and another's begins — where the villages in between have a genuine choice of which centre to head to. The buffer is where towns quietly compete, and where a service won or lost tips a whole community one way or the other.
Reading which streets become centres
There is a second tool, and it is the one that first taught me to read places this way. Space syntax — the analysis of street networks developed by Bill Hillier and his colleagues at UCL, which I first met at King's Cross in 1987 and have worked with ever since. Its central finding is what Hillier called natural movement: the configuration of the streets themselves, the pattern of connection, is a primary driver of where people walk. The most integrated streets attract the most movement, and movement is what makes a street a centre — where the shops cluster, where the footfall is, where a place comes alive.
Ringing the Peaks used these tools at the scale of a nation. The walking economy uses them at the scale of a high street. The same idea, inverted: not how regions relate across a country, but how a single town gathers the country around it, and which of its own streets carry the life.
Mapping the slow economy
If you could map the rural hinterlands and attach economic activity at the hyper-local level, you could begin to compare places honestly. Why does this town function better than that one? What work is in the catchment? What services, what shops, what banks? And, just as importantly, what is missing — what this town has that the one over the hill does not.
The disappearances are real and documented. UK banks have closed close to seven thousand branches since 2015 — roughly fifty a month — and rural communities feel it hardest. The country has lost more than a third of its pubs since the year 2000. Each closure removes not only a service but a reason to come into town, and a place where a community gathered. Map the catchment and these losses stop being a national average and become a specific hole in a specific place.
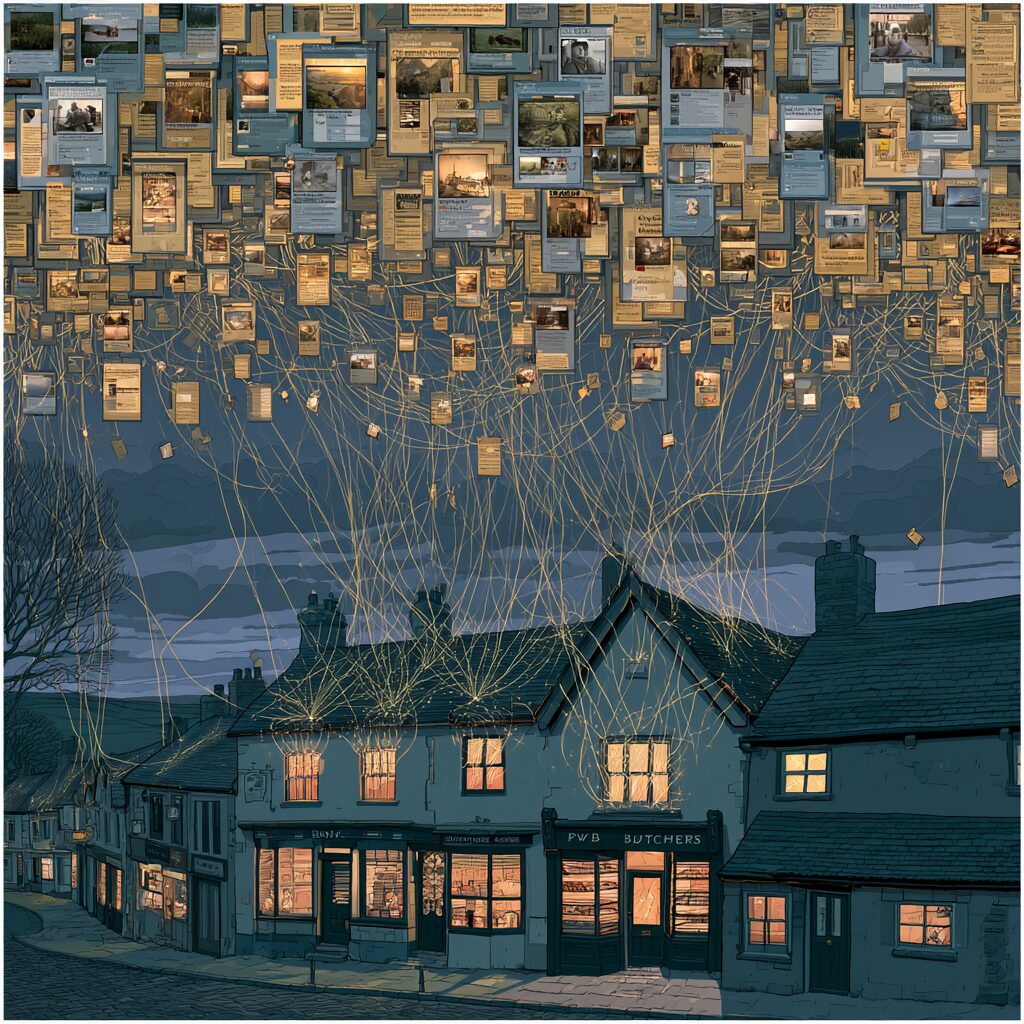
Reading the web of a place
Mapping businesses one by one used to be impossibly slow. It is not any more. Around the time I was developing this, I was talking with Glass.ai, who had built tools that read the open web much as a person might — what a business says it does, where it advertises, who works for it — and ran searches to link firms together and surface patterns. They had already used it to map innovation for the Welsh Government, in Nesta's Arloesiadur, and have since mapped whole national sectors for government.
It struck me that this was unusually well suited to the rural economy. In a city, any single business is drowned in the noise of a thousand competitors. In a market town it stands out. The signal is clean. Read the web of a small place and you can begin to see what is there and what is not — and then layer something softer on top: the sentiment of a place. Researchers have used geotagged photographs and social posts to map how people picture and describe somewhere — what they photograph, what they call it, what they say happens there. Gather what the web already offers, and a place starts to describe itself.
From map to opportunity
Once you can see a catchment and what fills it, the useful questions follow. Where are the gaps — the service this catchment could support but does not have? Where is the oversupply — three of something a town this size cannot sustain? The aim, at the time, was an insight tool: a way for a local authority or a tourism agency to judge what could be improved and strengthened, town by town, rather than county by county.
But the more interesting move was for the businesses themselves. This town supports two butchers; that one has none. Is there an opportunity for a butcher? Answering it well means reconfiguring a market appraisal into something a bank or a grant panel will recognise — exactly the move Farm in a Box makes for growers. The walking economy turns a hunch about a gap into a catchment-backed business case: here is the population within range, here is the spend leaving for the next town, here is the threshold a butcher needs and the evidence it is met.
The same data that shows a council what to strengthen shows a baker, a butcher or a bike shop how to make their case.
What could be tested
The way to find out is to run it on real towns. A pilot might take a handful of Welsh market towns — Dolgellau among them — map each one's walking catchment and buffer, layer the web-read business and sentiment data, and produce for each a simple picture: what the catchment is, what fills it, what is missing, and where a defensible business case might sit.
Stated as a wager we could be wrong about: that mapping a market town's walking catchment and layering web-read business and sentiment data reveals real, actionable gaps and oversupply that national statistics miss — and that at least some convert into fundable business cases. Signals of success across a pilot of six to ten towns: local people confirm the mapped gaps as real (not already served); the catchment model's predicted centre and footfall match what residents and footfall actually show; and at least one gap becomes a viable business case or grant application that secures funding or a new trader. The kill criterion is sharp — if the 'gaps' are mostly businesses that exist but have no web presence, the tool is measuring digital visibility, not economic reality, and would mislead anyone who trusted it.
What could stop this
Honesty first. Every web-reading method here over-counts the web-visible and under-counts the smallest, least digital rural traders — the very butcher with no website who is the heart of the walking economy. So a mapped gap is never a fact. It is a hypothesis, a low-confidence claim that has to be checked against the place itself before anyone acts on it. In our terms, a gap on the map is graded provisional until a local confirms it; a council record or a trade registry would raise it; a funded business that opens would settle it.
Two further cautions. Sentiment and photo data lean toward tourists and the photogenic, not residents and ordinary economic life, so they describe how a place is seen more than how it works. And a gap is not automatically an opportunity. The town over the hill may have no butcher because its catchment cannot sustain one — the lesson of The Market That Closed, where a sound offer still failed for want of a viable route to its customers. A tool that overstates a catchment would write confident business cases for shops that should never open. Naming that risk is the point: it tells the pilot exactly what it must prove before a single application is written.
Rooting a place
There is a quieter benefit, and it may matter most. To map the walking economy is to give a place back a tangible sense of its own catchment — to show a town the country it serves and the country that depends on it. That is the raw material of identity, and of pride. A place that can see its own hinterland knows what it is, and what it could be, in a way that no regional average will ever tell it.
Like Farm in a Box, Letting the Water Back In and It Takes a Village, this is not really about its subject. The butchers are the visible detail. Underneath is the same question: can a community see itself clearly enough to act — to keep value in the catchment, to back the trades that root it, to know what it has and what it lacks.
Map the walking economy, and a place stops being a dot on a fast network and becomes a centre with a country of its own.
This piece is the companion to Ringing the Peaks — the same configurational lens (Space Syntax, the King's Cross lineage), turned from the national network to the parish-scale catchment. It overturns one assumption: that the economy worth measuring is the fast one, the +60km/h world of motorways and intercity rail. The slow, rooted, walking-speed economy is where local vitality actually lives — and it can now be mapped. A natural follow-on would extend the insight tool toward the sentiment and place-identity work that points, in turn, at Awen Weave and agentic tourism.
Sources & confidence: Glass.ai — web-reading sector mapping; built Nesta's Arloesiadur for the Welsh Government (~2017) and now maps UK AI/cyber sectors for government [A]; central place theory (Christaller, 1933), threshold/range, Reilly's law of retail gravitation [A/B]; Space Syntax / natural movement (Hillier, UCL) [A]; geotagged-photo & sentiment place mapping — researchers' method, attributed not asserted [B]; UK bank-branch closures ~6,800 since 2015 (Which?), rural impact (House of Lords Library) [A]; pub losses >a third since 2000 (BBPA) [B]. A mapped 'gap' is a provisional, low-confidence claim until verified locally.